Want the latest insights? A 2023 update to this infographic is available here.
What do successful DE&I programs look like? What should organizations be doing to get ahead of their peers? Take a statistical look at these issues with this infographic, and start forging ahead with a program that rises above common DE&I roadblocks.
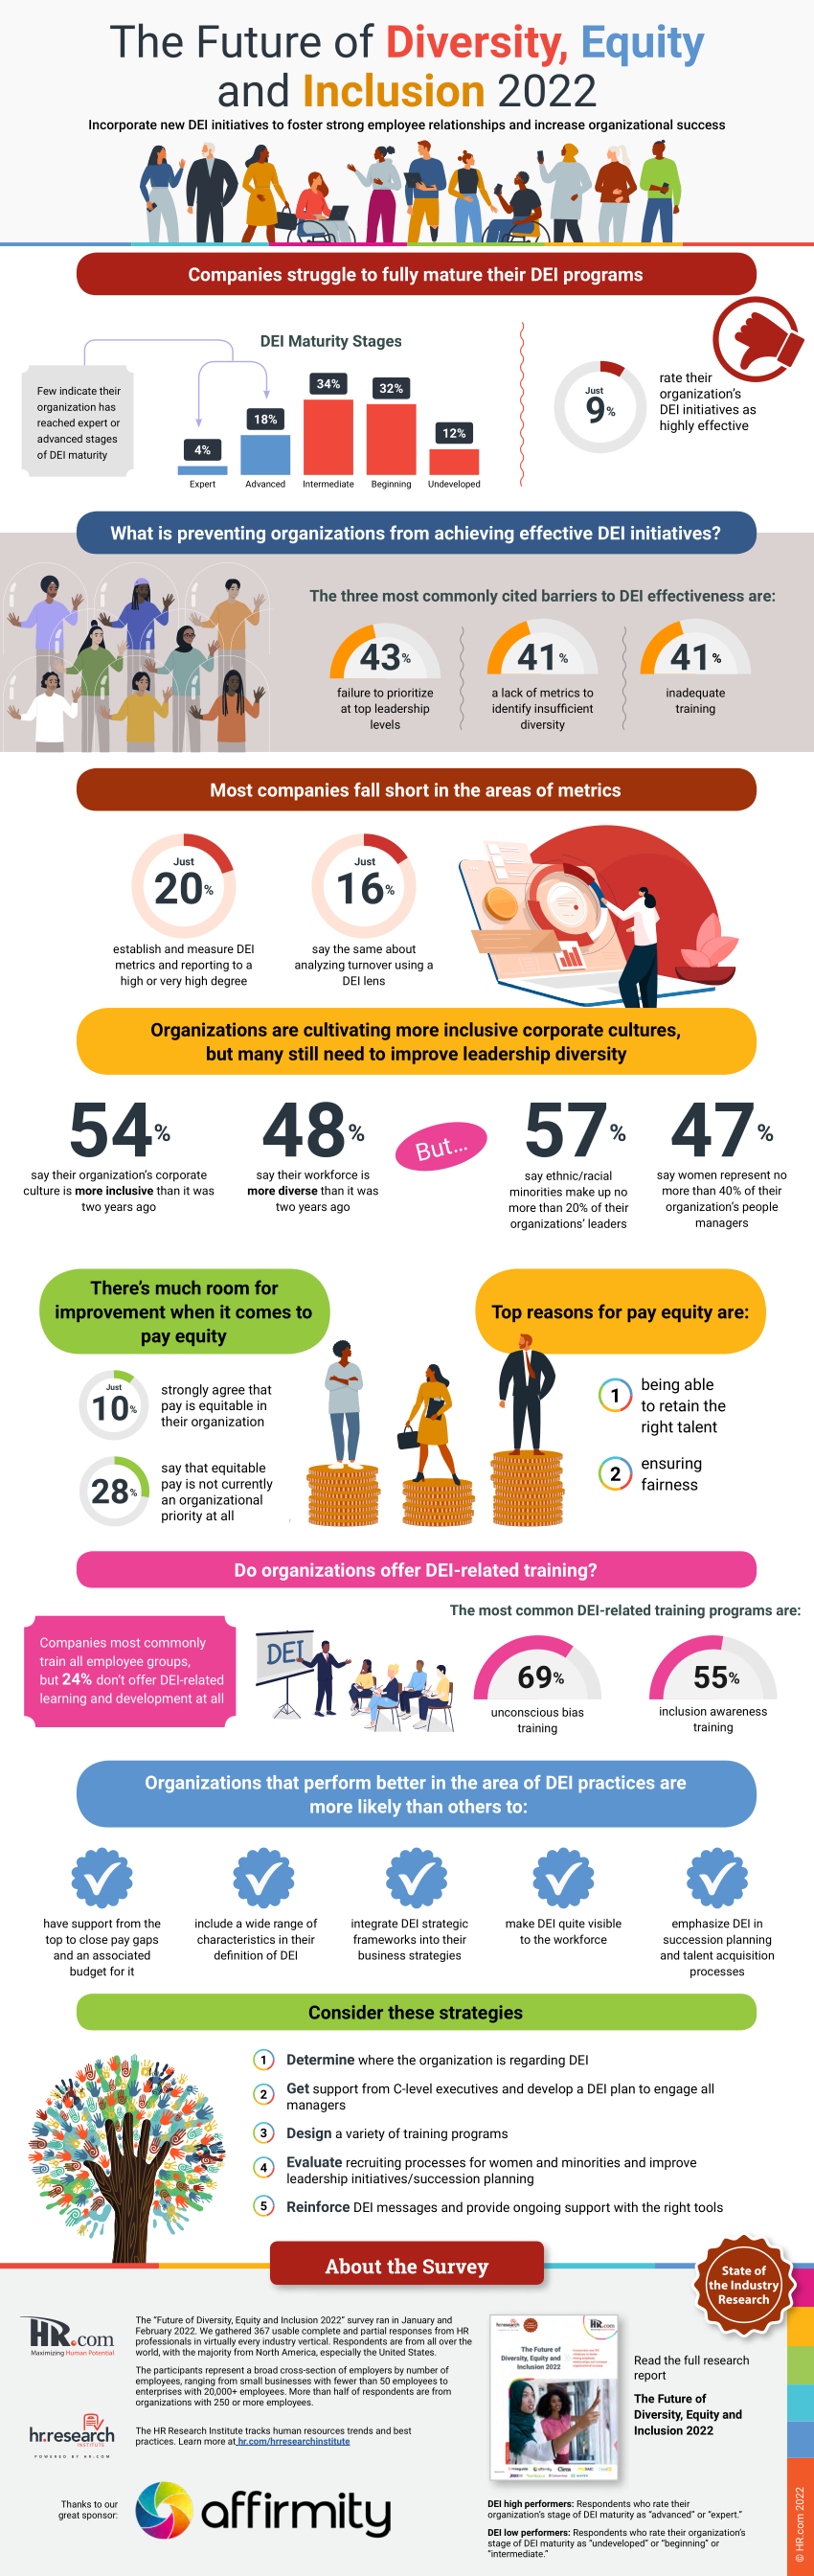
Based on the HR.com-authored, Affirmity-sponsored survey The Future of Diversity, Equity, and Inclusion 2022, this infographic highlights some major talking points raised by the data. At a time when companies appear to be struggling to fully mature their DE&I programs, take a data-based look at the major barriers, the analytics shortfalls, and representational issues that are holding businesses back. Then look over a quick summary of best practices and recommended strategies that will help you push past those blockers.
Key takeaway stats include that:
- 54% of respondents say their organization’s corporate culture is more inclusive than it was two years ago
- 57% report that ethnic/racial minorities make up no more than 20% of their organization’s leaders
- 43% point to failure to prioritize DE&I at top leadership levels as a significant barrier to program effectiveness
Keep scrolling to view the graphic, or download it here:
Click the button for a downloadable PDF version of this infographic.