
While only a few states explicitly ask organizations to perform AI bias audits, the reality is that introducing AI within your organization’s employment decisions is a risky proposition without making provisions for periodic auditing. In this article, Affirmity Principal Business Consultant Patrick McNiel, PhD, looks at a four-step approach to conducting an AI bias audit.
1) Consider Specific Legal Requirements and Local Risk Profiles
Before launching into your data analysis proper, it’s important to account for the implications of the current patchwork approach to AI lawmaking.
So, if you operate in New York City you’ll need to bear in mind that NYC requires a very specific output as well as consideration of individual categorizations and decisions made by AEDTs. However, because the specific output they require is somewhat simplified, it has the potential to mask or falsely show bias where none exists. There is consequently a high incentive for organizations to deploy additional, more rigorous analytical techniques in the background in order to proactively build a defense.
NEWS FROM AFFIRMITY | ‘Affirmity Launches Talent Decisions Software Module for Data-Driven and Defensible Processes’
2) Model Decisions and Decision Types, Then Make Comparisons
Your analysis needs to model your process, so you’ll want to get an accurate picture of how these tools are being used, what the populations are like, and when decisions are being made, especially when they’re being made on a comparative basis, as well as what the context is and whether that context changes.
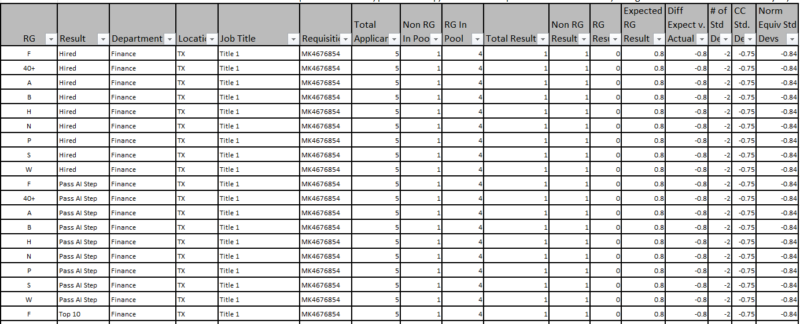
Figure 1: A mockup of a set of statistical tests.
The example table is a typical mockup of a test of a set of statistical tests. The left-hand half of the table defines the characteristics of each grouping to be studied:
- Reference Group (RG)
- Result (Hired, Passed AI Step, Top 10 etc.)
- Department (e.g. Finance)
- Location (State)
- Job Title
- Requisition Number
To the right of this are various applicant counts with reference to the pool and groupings, and some simple comparative calculations.
- Total Applicants
- Non RG In Pool
- RG In Pool
- Total Result
- Non RG Result
- RG Result
- Expected RG Result
- Difference Between Expected Versus Actual
The columns at the right-hand end of the table contain conversions to standard deviations for the statistical test used:
- Number of Standard Deviations
- CC of Standard Deviations
- Norm Equivalent Standard Deviations
This table is focused on requisitions because they represent potential unique decision contexts driven by an AI and parameters fed into an AI system. Because the context of selection may vary, the best statistical model of the actual process would control for the context. In this case a baseline analysis of requisitions using tests of the hypergeometric distribution provides the foundation for this control.
IMPORTANT NEWS FOR FEDERAL CONTRACTORS | ‘New Executive Order Directs Agencies to Add Anti-DEI Clause to Federal Contracts’
3) Look for Trends
The requisition level results in and of themselves are not very telling, but there are certain statistical tools that you can use to aggregate across requisitions. For example, using the information above, if you want to know what the trend is at the job title level, you can use a Mantel-Haenszel statistic, as this statistic can aggregate across requisition results having job titles in common to give a weighted overall indicator of adverse impact. Similarly, this can be done for the combination of job title and location, department, or any other aspect that can be tied to a requisition.
This gives you a lot of power to determine what’s happening and where. Furthermore, you’re doing it in a way that respects the context in which the AI is operating. And one of the reasons you have to do that is because every requisition might have different parameters that were set for it to create, for example, a match. To illustrate, if you’re doing a hired score match, even if it’s the same job, and if you’ve got a different ideal candidate slotted into two different requisitions, the context has changed between requisitions.
The context not only concerns how the algorithm is working, but also the demographic distribution of people entering the requisition for which the AI is making decisions. This is especially important if the AI is rank ordering people, since order is determined by comparators.
We recommend organizations investigate by requisition, and when aggregating across requisitions, look for whether the AI produces a trend that shows potential bias against females, against individuals aged 40+, or against different racial groups, and so on.
4) Summarize Your Information for Further Analysis
As you can probably tell, even a small analysis will inevitably lead to a table with thousands of rows. This means you’ll need a way to aggregate this information and parse its implications. So, you could collect the statistical significance level for each row in your output for a particular part of your organization and put it into a grid like this example.
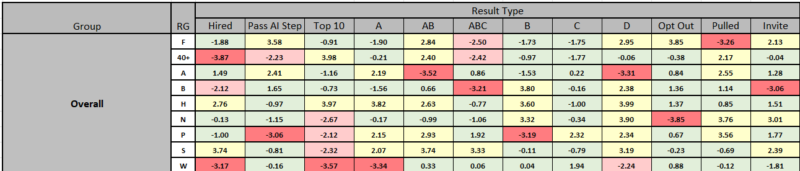
Figure 2: A mockup of a table aggregating the audit data.
This allows you to look at the whole organization and understand which demographic groups may be having more trouble in different parts of your hiring process. This also allows you to assess risk. For example, white applicants in the table above are hired less. This shows some EEO-related risk in the hiring process if such differences cannot be shown to be caused by valid or job-related mechanisms. The question is then, is AI one of those mechanisms? The results show it might be, as whites are underrepresented in the top 10 candidates and in the highest class (Class A). This would indicate the AI system is causing some risk. However, White applicants are not failing that step at a higher rate. So, something, perhaps recruiter intervention, is mitigating that risk.
Generally, if you find no statistical significance in your overall hiring process, even if the AI shows some adverse impact, there’s less risk involved. If there is statistical significance in your overall hiring process, your risk goes up considerably in that same situation. The additional context this adds is why you’d want to do the full app-to-hire analysis as part of an AI bias audit.
MORE ON ESSENTIAL MONITORING | ‘How to Monitor Non-Discrimination Programs and Title VII Compliance in 2026’
Learn About the Legality of Using AI in Your Employment Processes
You’ve been reading an extract from our 20-page exploration of the current AI landscape, “AI Use in Employment Decisions and the Emergence of AI Bias Audits.” Here’s what you can expect when you download the full ebook:
- Examples of common uses for AI tools
- The benefits and drawbacks of using AI tools and traditional tools
- The laws and lawsuits that define the current legal landscape
Equip yourself with expertise for a new era of employment processes and compliance: download the full ebook, and contact us today to learn about our risk assessment and analysis solutions.
About the Author

Patrick McNiel, PhD is a Principal Business Consultant for Affirmity. Dr. McNiel specializes in workforce analytics using both qualitative and quantitative methods to analyze employment practices and inform employment decisions. Dr. McNiel holds a PhD in Industrial and Organizational Psychology, and is licensed to practice psychology by the State of Texas. Connect with him on LinkedIn.