Organizations are often guilty of doubling up on the data underpinning their affirmative action plans. We regularly see situations where one group creating these plans is siloed off from those working on diversity and inclusion. Find out how to get to the point where you have consistent information across your organization in this article looking at some common data issues and their solutions.
Lack of information sharing is obviously inefficient, and in some cases groups can even have divergent agendas, sowing the seeds of confusion throughout the wider business. Without alignment you risk:
- Doing the same work twice
- Telling different stories about similar subjects based on data from different points in time
- Creating trust issues with data that appears less consistent than it needs to be
Consider the other types of reporting you’re doing in the business: if it’s dealing with similar data points, is it all being collected at different times of the year? Is it being recorded in a consistent way? Is it measured against the same benchmarks and goals?
You spend a lot of time collecting data. It’s better to invest time now in ensuring that this work is pulled together and efficiently leveraged both inside and outside of the organization. From diversity and inclusion teams, to the recruiters working to fill positions and fulfil your programs, everyone could stand to benefit!
Issue #1: Your Internal Data Differences
The overlap between affirmative action planning data and the data needed for your diversity and inclusion programs isn’t substantial, but they aren’t a 1:1 match. AAPs are focused on the representation of females, minorities, veterans, and individuals with disabilities. DE&I has a wider remit, additionally covering males, non-minorities, different age groups, sexualities, gender identities, and more. Nonetheless, a large chunk of data is already collected for your affirmative action plan—so why not use it?
Whatever your chosen snapshot date, it needs to be consistently applied across all data sources, as well as historically (i.e. the last two to three years). For organizations taking their first steps in leveraging data analysis, this pattern needs to be established as soon as possible.
Once a unified set of data is collected, and knowing that you have these different audiences for similar information, you have to carefully consider how you’re going to present the information to different stakeholders. In larger organizations, this won’t just be about different functions (such as AAP and DE&I), but will also take into account the different needs at certain levels and areas of leadership.
For example, while one group may need to see breakdowns by region, another may want the data broken down by division head. Decisions like these will depend on where leadership lays across multiple affirmative action plans. However, taking time to get these groupings right can ensure you’re equipped with the necessary insight into the impact of your work.
LEARN HOW TO TAKE ACTION | ‘How to Create a Veteran-Fueled Business: HIRE Vets Award Winners Reveal All [Q&A]’
Issue #2: Knowing How You Should Be Benchmarking
If you’re involved in preparing an affirmative action plan, you know that it’s essential to have something to benchmark your demographic, hiring, selection, and retention data against. These benchmarks need to be reliable, applicable, and realistic. If you find representation significantly lower than reasonably expected, you may require placement goals to address the shortfall.
It’s common to look at external benchmark data from sources such as census data, or American community survey data, that give a realistic idea of what’s available from a specific skill standpoint across a relevant geographic area. Affirmity’s teams work together with customers to really understand what their recruiting patterns are… or need to be. Your organization should be looking at crucial questions such as:
- How often do you recruit from within your organization versus externally?
- Where are you recruiting from for different job roles, and for different locations around the country?
- Are you recruiting from a certain county or state, or a combination of counties, or states?
- Do you recruit at colleges and universities?
- Are you looking at this information internationally?
Taking the time to look at a range of different benchmarks will help you build realistic and engaging targets that will impact your programs positively.
Solutions: How Consultancy and Software Will Help You Take Data Further
At the heart of the solution to your data methodology and reporting issues is a proactive approach—whether that’s by having experts look over your data at the right time, or having machines crunching the numbers continuously and making insights available the second that a key stakeholder realizes they need them.
If, for example, you identify an area of potential adverse impact during an impact ratio analysis, it’s required that you investigate that area further to find the cause. If you wait until an audit picks up on it, it’s already too late! You’ll really just be trying to minimize the fallout at that point.
Instead, do the work now to pool your data, assemble a team, and get the right systems in place. Read on to discover three key solutions from Affirmity that will help you achieve this. Your organization’s future may depend on it!
Solution #1: Data Validation and Reconciliation Services
Because your efforts will bring so much good data into the fold, it will present an analysis paralysis risk. Once good data is collected, it still needs to be reduced into digestible, stakeholder-tailored forms to reduce distraction and keep everyone laser focused on the most important details.
Affirmity is an established expert in this area: we regularly create ad hoc reports for our clients that help them narrow the focus to certain positions, pay grades, and pay bands in addition to the wider view. Gathering this data is also dependent on robust and efficient reconciliation efforts. This process will improve the quality of your reporting, overall team efficiency, and responsiveness to inquiry.
In the course of data reconciliation, Affirmity’s data analysts work through your employee and historical transaction data to find:
- Missing fields
- Duplicate records (e.g. two terminations, two promotions)
- Opportunities to review or update job group structure
- Instances where job titles have erroneously been assigned to multiple job groups
- Other Job group/EEO code inconsistencies (e.g. division between union and non-union, exempt and non-exempt)
- Race and gender inconsistencies compared against previous year (e.g. individuals may provide different answers during application and onboarding)
- “Includes/excludes” assignment errors
- Employees erroneously reported with $0.00 annual compensation
- Inconsistencies with historical hire records and applicant flow data
However you choose to set about reconciling your data, it’s something of a “pay now, or pay later” proposition. The earlier you get things cleaned up, the sooner you can be sure that what you’re telling leadership is accurate. It’s also an essential part of audit preparation: if your data isn’t dependable and defensible, you may be in big trouble!
MORE ON SHARED DATA | ‘How to Connect Your Pay Reporting Requirements to Your Pay Equity Efforts’
Solution #2: Having the Right Technology On Your Side
It’s very important to identify the data in your organization that’s worthy of being brought together to fuel your insights. However, the reality is that it likely exists not only across different teams and locations, but within different systems. The process of manually collating all of that data into meaningful reports is inevitably time-consuming.
Thankfully, software exists to bridge the gap. Rather than manually exporting data and compiling a file to give to whoever needs it, Affirmity’s products and services will automate part or all of the process for you.
Standard reporting from Affirmity’s CAAMS® software includes:
Current Workforce Gap Report
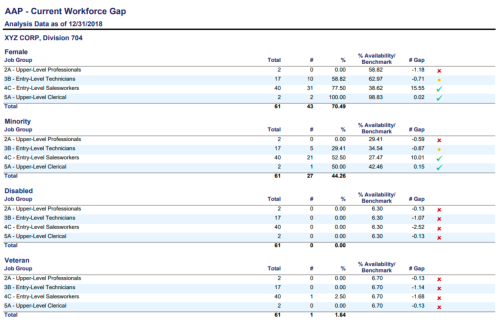
What does it do? This report allows you to share vital information at a glance with stakeholders at all levels of your organization. It compares your current workforce demographics against your availability benchmark and gives a simple green tick, yellow asterisk, or red cross depending on your current performance.
How will it help my organization? The current workforce gap report is designed to help you proactively identify and manage areas of your business that are likely to be flagged in an audit. This information will enable you to take corrective action before it becomes a much bigger issue.
Talent Lifecycle Chart
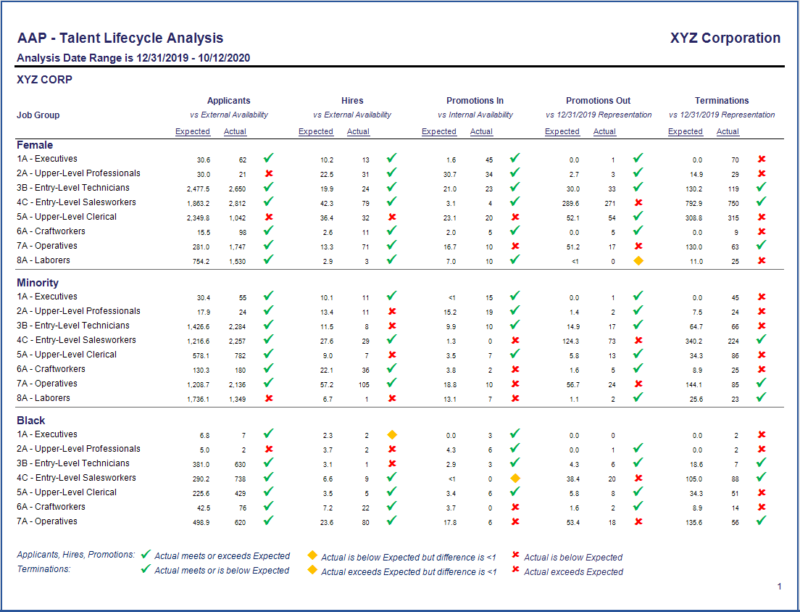
What does it do? The talent lifecycle chart provides a similarly easy-to-understand traffic light overview of demographic and job group performance in your business. This report additionally looks at your performance versus external availability or representation at five key stages: applicants, hires, promotions in, promotions out, and terminations.
How will it help my organization? The talent lifecycle chart is designed to not only help leadership understand whether sourcing and recruiting efforts are using the available pool, but also to determine whether the organization is making the most out of available internal talent.
Current Workforce to Availability Progress
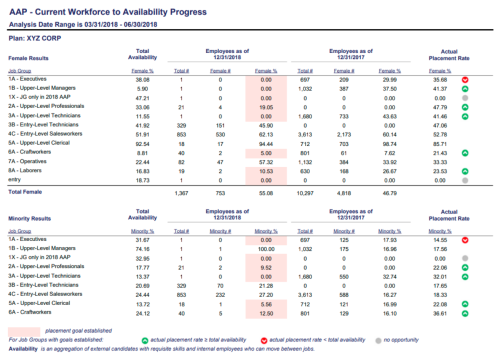
What does it do? This report adds a change-over-time perspective to availability data for your job groups.
How will it help my organization? It’s ideal for informing key stakeholders of your progress throughout the year and across the years, keeping everyone informed of your progress towards your goals. It may also act as an early warning system for future problem areas that would otherwise not be picked up until a later reporting cycle.
JOINING UP AAP AND DE&I THINKING | ‘Answering 11 Questions That Will Help You Use Data to Improve and Advance Your D&I Program’
Solution #3: Taking a Total View for AAPs
The work that goes into this new data analysis and reporting methodology is substantial, but it will count for little if it’s not also timely. The quicker we can use technology to generate insights, the quicker we can start identifying areas of opportunity and attention.
One approach that Affirmity has pioneered is TotalView, a key piece of functionality within Affirmity’s CAAMSⓇ software that easily allows multidimensional views across the organization. Rather than looking at your organization plan by plan, or location by location, we aim to slice the analysis whenever and in whatever way makes the most sense for each organization. TotalView functionality expands data use beyond affirmative action plans to consider the way an organization runs—an essential stance when it comes to getting buy-in from all levels of management.
You can use TotalView functionality in Affirmity’s CAAMS software to:
- Create roll ups and breakout reports
- View specific functional unit compliance (i.e. by FAAP, Functional Affirmative Action Program)
- View data along geographical or business unit lines
- Run multiple views of your organization concurrently
Affirmative action plans can provide a somewhat overwhelming and rigid view. It can be easy for individuals in the organization to struggle to see an AAP’s relevance to their department. This makes it difficult for the whole organization to move forward in coordination. TotalView can provide different, more relevant views, such as a specific brand or departmental views of current AAP performance and actions.
Because this TotalView method allows AAP data to be more precisely tailored in this way, many Affirmity clients have seen its potential as an internal management tool, as well as an input into DE&I reporting.
Create a Collaborative Approach to Affirmative Action Excellence—Keep Reading!
AAPs are packed with information that could be helping multiple people in your organization make better work decisions all year round—and with some tweaks to your process, you could achieve more besides. After looking at the data analysis methodology points above, our full guide also considers:
- Pointers for building business engagement and accountability through regular updates, frequent tracking, and better interdepartmental relations
- What the pattern of compliance maintenance and oversight you’ll eventually want to settle into looks like
Download the full guide today.

Want to find out more about how Affirmity’s software and service solutions can raise awareness, mitigate risk, and build management accountability for your compliance efforts? Contact our team today.