While producing location-based affirmative action plans is an important part of a federal contractor’s obligations, the data you collect for this purpose can go a lot further when combined with other sources of information within your organization. With TotalView, a methodology available within Affirmity’s CAAMS® software, you can greatly expand your ability to report on—and to—different parts of your business, or even your entire organization as a whole.
In this article, we take a closer look at how TotalView makes this possible while reducing the time you spend generating all reporting types.
What Is TotalView?
Your affirmative action plans are typically focused on your establishments: a tiny sliver of your overall hierarchy, which may additionally consist of departments, locations, business units, divisions, regions, and districts. Organizations are obliged to analyze their establishment-based picture for the purpose of compliance. Even considering the possibility of opting into functional AAPs, it’s likely that your organization would benefit from being able to slice its reporting using other hierarchical levels.
Indeed, many organizations will have internal stakeholders who have similar questions to those covered by your AAPs, just for different hierarchical levels of your organization. Typically, answering these questions would require out-of-cycle reporting involving fresh data collection and analysis—a time-consuming endeavor.
Affirmity’s methodology for tackling these different reporting segmentations is called TotalView. TotalView is a functionality within Affirmity’s CAAMS® software that gives your company the level of visibility needed to identify patterns across the organization, see how the interconnected parts of the business are working together, and share this information with key stakeholders.
IMPORTANT INSIGHTS FOR AAP STRUCTURE | ‘Affirmative Action Scope: When Is an AAP Required, Who Should Be Included, and How?’
Exploring Different Reporting Types Available With TotalView
When reporting is scaled up to your whole organization, it can seem like there’s little time left over after simply ensuring compliance. You may have five plans, 50 plans, or more—and with the resources available that may be quite a daunting task. Fortunately, TotalView makes it possible to produce these establishment-based plans alongside additional reporting formats with no extra effort.
This means it’s possible to take care of your AAPs, then start breaking down the organization in ways that make sense to how you do business. TotalView gives you the ability to see representation numbers across the board, benchmarks at every level of the organization, selection activity, hires, promotions, terminations, transfers, applicant flow, and compensation data. This may lead you to identify larger-scale patterns that have historically been more difficult to discern when just considering things location by location.
Different teams in your organization—such as your DE&I, compliance, and management teams—are likely to have different use cases for reporting views, so it’s important to explore their needs and build reports that serve them. Thankfully, this is something that, after a straightforward initial set up, can be done within and alongside your usual AAP preparation timescale. Furthermore, these reports could be made available to your stakeholders on whatever cadence they require—whether that’s every six months, quarterly, or monthly.
In this way, instead of letting your AAP data sit on the shelf waiting for an audit, you can actually start using this information to improve your organization. As you start bringing more people into the fold, they’re going to ask more questions and want more reporting to answer those questions. With a methodology like TotalView, it’s going to be a lot easier to answer those questions quickly—or at all.
Example TotalView Use Cases and Reports
Of course, TotalView is dependent on your organization having the right data. Thankfully, most companies out there already have robust systems in place that house the necessary data. For example, your organization’s human resource information system (HRIS) is likely to record where people are and what department, district, region, or business unit division they’re associated with. These details will be essential for creating the different reporting views that TotalView enables.
With the same data—and no extra effort—TotalView means you can both:
- Provide a department supervisor with a view of what their location or department looks like from a talent lifecycle perspective
- Provide the CEO with a report that shows the same metrics but across the entire organization
How to Visualize Your Talent Lifecycle for Key Stakeholders
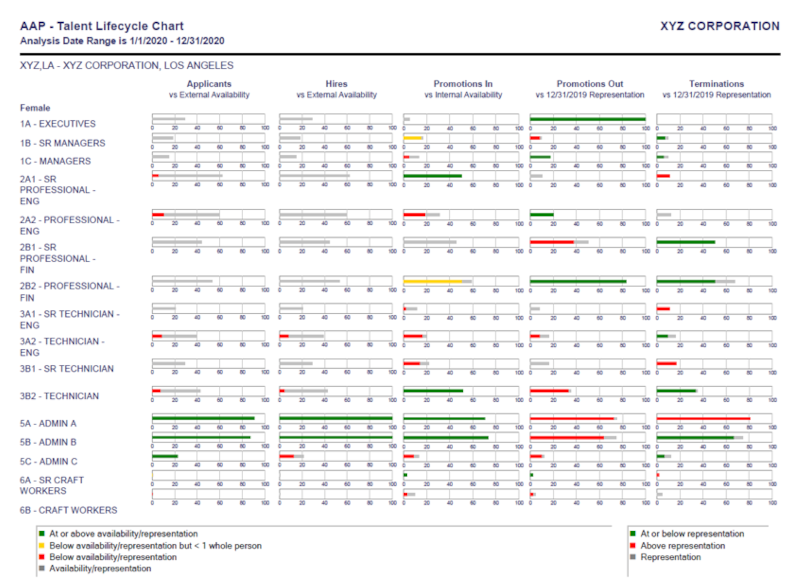
The example Talent Lifecycle Chart above uses information from an organization’s applicant tracking system (ATS) and HRIS and shows a per-job group view of every stage of the talent lifecycle.
As each bar uses a simple traffic light system, your stakeholders can easily review their charts for red and yellow areas, and investigate accordingly. The data may prompt an investigation of whether sourcing and recruiting efforts are fully utilizing the available external applicant pool, for example. An investigation of internal talent may also be necessary if the data suggests the possibility that certain groups are being filtered out of the promotion process.
The graph also shows benchmark data as a gray bar, providing important additional context that differs for reports at different organizational levels (benchmarks will vary in department, business unit, or division-based views). This helps stakeholders understand what they may need to contribute in order for the entire organization to have an opportunity to meet its goals.
FURTHER THOUGHTS ON COMMUNICATING WITH STAKEHOLDERS | ‘Getting the Business On Your Side: How to Talk About Affirmative Action Data With Everyone Else’
Another Important Use Case: Compensation Analysis
When the OFCCP starts to interrogate your organization’s compensation data, it’ll typically take it and run a regression analysis. Therefore, your organization would benefit greatly from being able to run preemptive regression analyses for each of its locations, as a routine piece of pre-audit preparation.
The TotalView methodology enables this kind of preemptive approach. We recommend that you perform these analyses through legal counsel so that you can maintain privilege, but the capability itself is a powerful one, and best run at least once every couple of years. If you have robust data in your HRIS, you likely already have all the information you need to get started—you just need the right software, and you’ll be better prepared for any potential issues that you may not currently be aware of.
LEARN MORE ABOUT OFCCP AUDITS | ‘What Are the 26 Items on the OFCCP’s Scheduling Letter and Itemized Listing?’
The Data TotalView Needs From Your Systems—And How That Data Is Changing
So, what data are required in order to take a TotalView approach? In most cases, your organization’s HRIS and ATS will provide three key data sources: employee data, historical data, and applicant data.
Key data from your HRIS includes:
- Employee data: A point-in-time snapshot of your workforce, which will be available either as one large file or multiple files. For TotalView purposes, no specific format or column order is necessary.
- Historical data: Covering hires, promotions, terminations, and transfers. This data aids in identifying internal feeder pools and gives an accurate view of recruiting practices while simplifying the assignment of internal and external weighting.
Key data from your ATS includes:
- Applicant data: Used to measure the effectiveness of applicant sources, and can be used to prepare Impact Ratio Analyses for hires at each monitoring point throughout the year.
Recent historical data is particularly important to consider at this moment in time, because most organizations have experienced new patterns as a result of the pandemic and the rise of work-from-home and hybrid working models. This means that organizations that have carried the same internal and external weightings since before 2020 are likely working out of step with their current reality. Not only are people working differently, but many organizations are hiring differently as a result: they may have better access to skilled people in different parts of the country than they’ve previously relied on.
These changes need to be reflected in your AAP: you must adjust the census codes you’re using for all of your different skill sets, reflecting the (likely expanded) range of labor markets you’re taking advantage of. This will, in turn, have a huge impact on the goals you’ve set.
Another change that organizations may want to make is to look beyond residence-based census data and consider other forms of availability data, such as industry-specific data. This is particularly true if your organization has very specialized positions or you find it difficult to find qualified candidates in the areas that you’re looking in. Opting to use industry-specific data will give you a more realistic benchmark to target when compared to census data, and again, will influence the goals you set and work toward.
MORE ON YOUR AAP DATA | ‘Incomplete, Inaccurate, Inconsistent: How the 3 “I”s Sow Chaos in Your Affirmative Action Data’
Make Sure Your Training Helps Your Teams Achieve Their Goals
When TotalView helps your organization more efficiently manage the technical aspect of putting AAPs together, you’ll have more time for other important aspects of your AAP process. Obviously, making progress on the actions your AAP describes should be a priority, but it’s also important to consider how your training of recruiters, hiring managers, and leaders has a role to play in ensuring the efficient delivery of AAP efforts.
Training can be an area that organizations skimp on, and this can be a risky lapse in best practice. If a manager doesn’t really know what the purpose of the affirmative action program is, is it reasonable to expect them to know how to help the organization achieve its goals? Managers at all levels and specific functions, such as talent acquisition, need to be informed about their responsibilities, and the training needs to be tailored to those responsibilities. This, of course, goes for not only females and minorities, but for veterans and individuals with disabilities as required under VEVRAA and Section 503.
Furthermore, though the reports themselves are built to be easy to interpret, it’s still important to train your people on reading them and the appropriate actions they should take to address what they show.
In Conclusion: Achieving Maximum Visibility
Though TotalView is a specific set of reporting views and data collection processes in Affirmity’s CAAMS® software, it speaks to a wider AAP methodology that every organization would benefit from implementing. Any organization that focuses solely on producing establishment-based plans isn’t benefiting from the full range of possibilities that the data it collects presents. With the right reporting software, this data can tell you more about your organization, and it can inform areas of the business that are absolutely critical to not just your affirmative action work, but other key HR processes too.
As we’ve seen, in order to maximize the effectiveness of the kind of expanded methodology that TotalView represents, you must:
- Review your current reporting process
- Engage with stakeholders across the organization
- Review your benchmark-setting approach
- Account for changing recruitment patterns
- Reassess the labor markets that you use
- Address AAP awareness across the organization
- Deliver relevant training to all groups and ensure everyone has the knowledge and the tools necessary
- Regularly re-inform your talent acquisition team and hiring managers about your current goals and how they can help
And best of all, this is just scratching the surface of what is possible. If you would like to learn more about working with Affirmity and TotalView, please don’t hesitate to get in touch!
Discover how Affirmity’s software and service solutions, including the TotalView methodology within CAAMS®, can help you increase AAP visibility across your business. Contact our team today.
About the Author
 Roy Zambonino is a senior solutions consultant at Affirmity. He is responsible for demonstrating and discussing Affirmity’s wide range of DE&I and affirmative action planning products and services with existing and prospective clients.
As a former project manager, Mr. Zambonino is able to draw upon the best practices he’s observed over the last 20+ years helping prepare and implement programs. This work has involved companies ranging in size from a few hundred to several hundreds of thousands of employees, and spans across many industries including retail, construction, healthcare, banking, and finance. Mr. Zambonino has a Bachelor’s and Master’s degree in Business Administration.